


🔹 Introduction
The NVIDIA GeForce RTX 5080, part of the Blackwell architecture lineup, positions itself as a high-end card under the RTX 5090. With DLSS 4 and Multi-Frame Generation support, it's promoted as a value-focused alternative. But how does real-world and synthetic performance stack up versus the RTX 4090 or RTX 4080 Super?
After seeing how efficient it is, the RTX 5080 vs 4080 results will help you decide if it’s time to retire your old card.
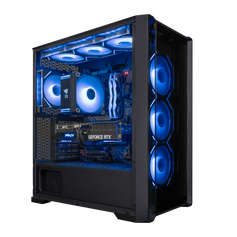
Efficiency-focused testing shows how a RTX 5080 gaming PC setup can deliver top-tier performance without excessive power draw.
Let's examine FPS benchmarks, render scores, power efficiency, and where the 5080 really shines.
🎮 Gaming FPS Benchmarks
🔸 Dragon’s Dogma 2 @ 4K & 1440p
RTX 5080 Dragon’s Dogma 2 benchmark chart 4K & 1440p
-
4K Ultra: ~57% slower than 5090, ~20–25% behind 4090
-
1440p: ~134 FPS on 5080 – around 10% faster than RX 7900 XTX and 4080, but trailing the 4090 by ~20 FPS
🔸 Starfield @ 1080p
-
~132 FPS average, ~17% slower than RTX 4090, ~24% slower than RTX 5090
-
Matches RTX 4080 Super around error margins
🔸 Dying Light 2 @ 4K
-
~81 FPS → ~13% behind RTX 4090, ~56% behind RTX 5090
-
Still ~12% lead over RX 7900 XTX and 21% over RTX 4080 Supe
🔸 Marvel Rivals @ 1440p
RTX 5080 Marvel Rivals fps benchmark
-
~108 FPS average → ~8% faster than RX 7900 XTX, ~14% faster than RTX 4080 Super
-
Around 9% slower than RTX 4090
🔬 Synthetic & Content Creation Benchmarks
🔹 Blender, V-Ray, Maya Viewport Rendering
RTX 5080 content creation viewport and render performance
-
RTX 5080 delivers viewport rendering clock speeds comparable to RTX 5090, up to ~40% faster than RTX 4080 Super in complex scenes
-
Final render times show notable speed-ups, especially with AI-powered workloads
-
AI benchmarks (Procyon, Geekbench) claim y~55–188% faster than 3080 Ti, ~10–20% ahead of 4080 Super
⚙️ DLSS 4 & Multi Frame Gen
🔹 F1 24 @ 4K DLSS 4 + Frame Gen
RTX 5080 F1 24 DLSS 4 benchmark chart 4K
-
~119 FPS native vs ~219 FPS with DLSS 4 + Frame Gen
-
Efficiency and image quality make RTX 5080 stand out versus RX 7900 XTX and even RTX 5090 in this mode
-
Some reported performance quirks in early driver versions
⚡ Power Consumption & Efficiency
🔹 Final Fantasy XIV @ 4K Efficiency
RTX 5080 power efficiency chart FFXIV 4K
-
~298 W power draw, delivers high FPS → better efficiency than RTX 4080 Super and 5090 (approx. 0.75 FPS/W vs 0.34 for RTX 5090)
-
Idle GPU power is very low (~12.75 W) compared to RTX 4080 (~15–16 W) and RTX 5090 (~46 W)
🔹 Overall Efficiency Summary
-
Strongest in 4K raster or upscaled workloads
-
Less power draw with same or better performance versus RX 7900 XTX
-
Ideal for efficiency-oriented builds with high FPS
📊 Summary Table
| Test / Task | RTX 5080 Performance | Relative Comparison |
|---|---|---|
| Dragon’s Dogma 2 @ 4K | Moderate (~57% slower than 5090) | ~20–25% behind RTX 4090, ahead of RX 7900 |
| Starfield @ 1080p | ~132 FPS | ~17% slower than 4090 |
| Dying Light 2 @ 4K | ~81 FPS | ~13% behind 4090 |
| Marvel Rivals @ 1440p | ~108 FPS | ~14% ahead vs 4080 Super |
| Blender / Render Workloads | +10–20% over 4080 Super | Massive lead over Ampere |
| F1 24 DLSS 4 + Frame Gen @ 4K | ~219 FPS | Outperforms 5090 in FPS; better QoL |
| Efficiency (FFXIV 4K) | ~0.75 FPS/W | Best in class, beats 4080 & 5090 |
✅ Verdict: Is RTX 5080 Worth It?
✔️ Strong Points
-
Excellent AI-powered rendering and lower-latency upscaling with DLSS 4 and Frame Gen
-
Efficiency leader in power-sensitive high-resolution PCs
-
Better price-performance than RTX 4080 Super for 4K raster, and competes well vs RTX 4090 in many game scenarios
⚠️ Limitations
-
Gaming gains are often single‑digit to mid‑teens compared to RTX 4080 Super and RX 7900 XTX
-
Native ray-tracing trails RTX 4090 by up to 14% in some titles
-
Some early driver maturity issues, especially at 1080p bottlenecks and corner-cases


